
Linux and Windows
Collect critical metrics from your servers using multiple methods: SNMP, SSH, local agent, Prometheus Node Exporter or Prometheus Server.
Virtualization
Support for VMware vSphere, KVM and Proxmox VE environments.
Automatic mapping between hosts, virtual machines and storage.
Cloud VMs
Monitor AWS, Azure, and GCP resources with built-in analytics for performance, health, and cost insights.
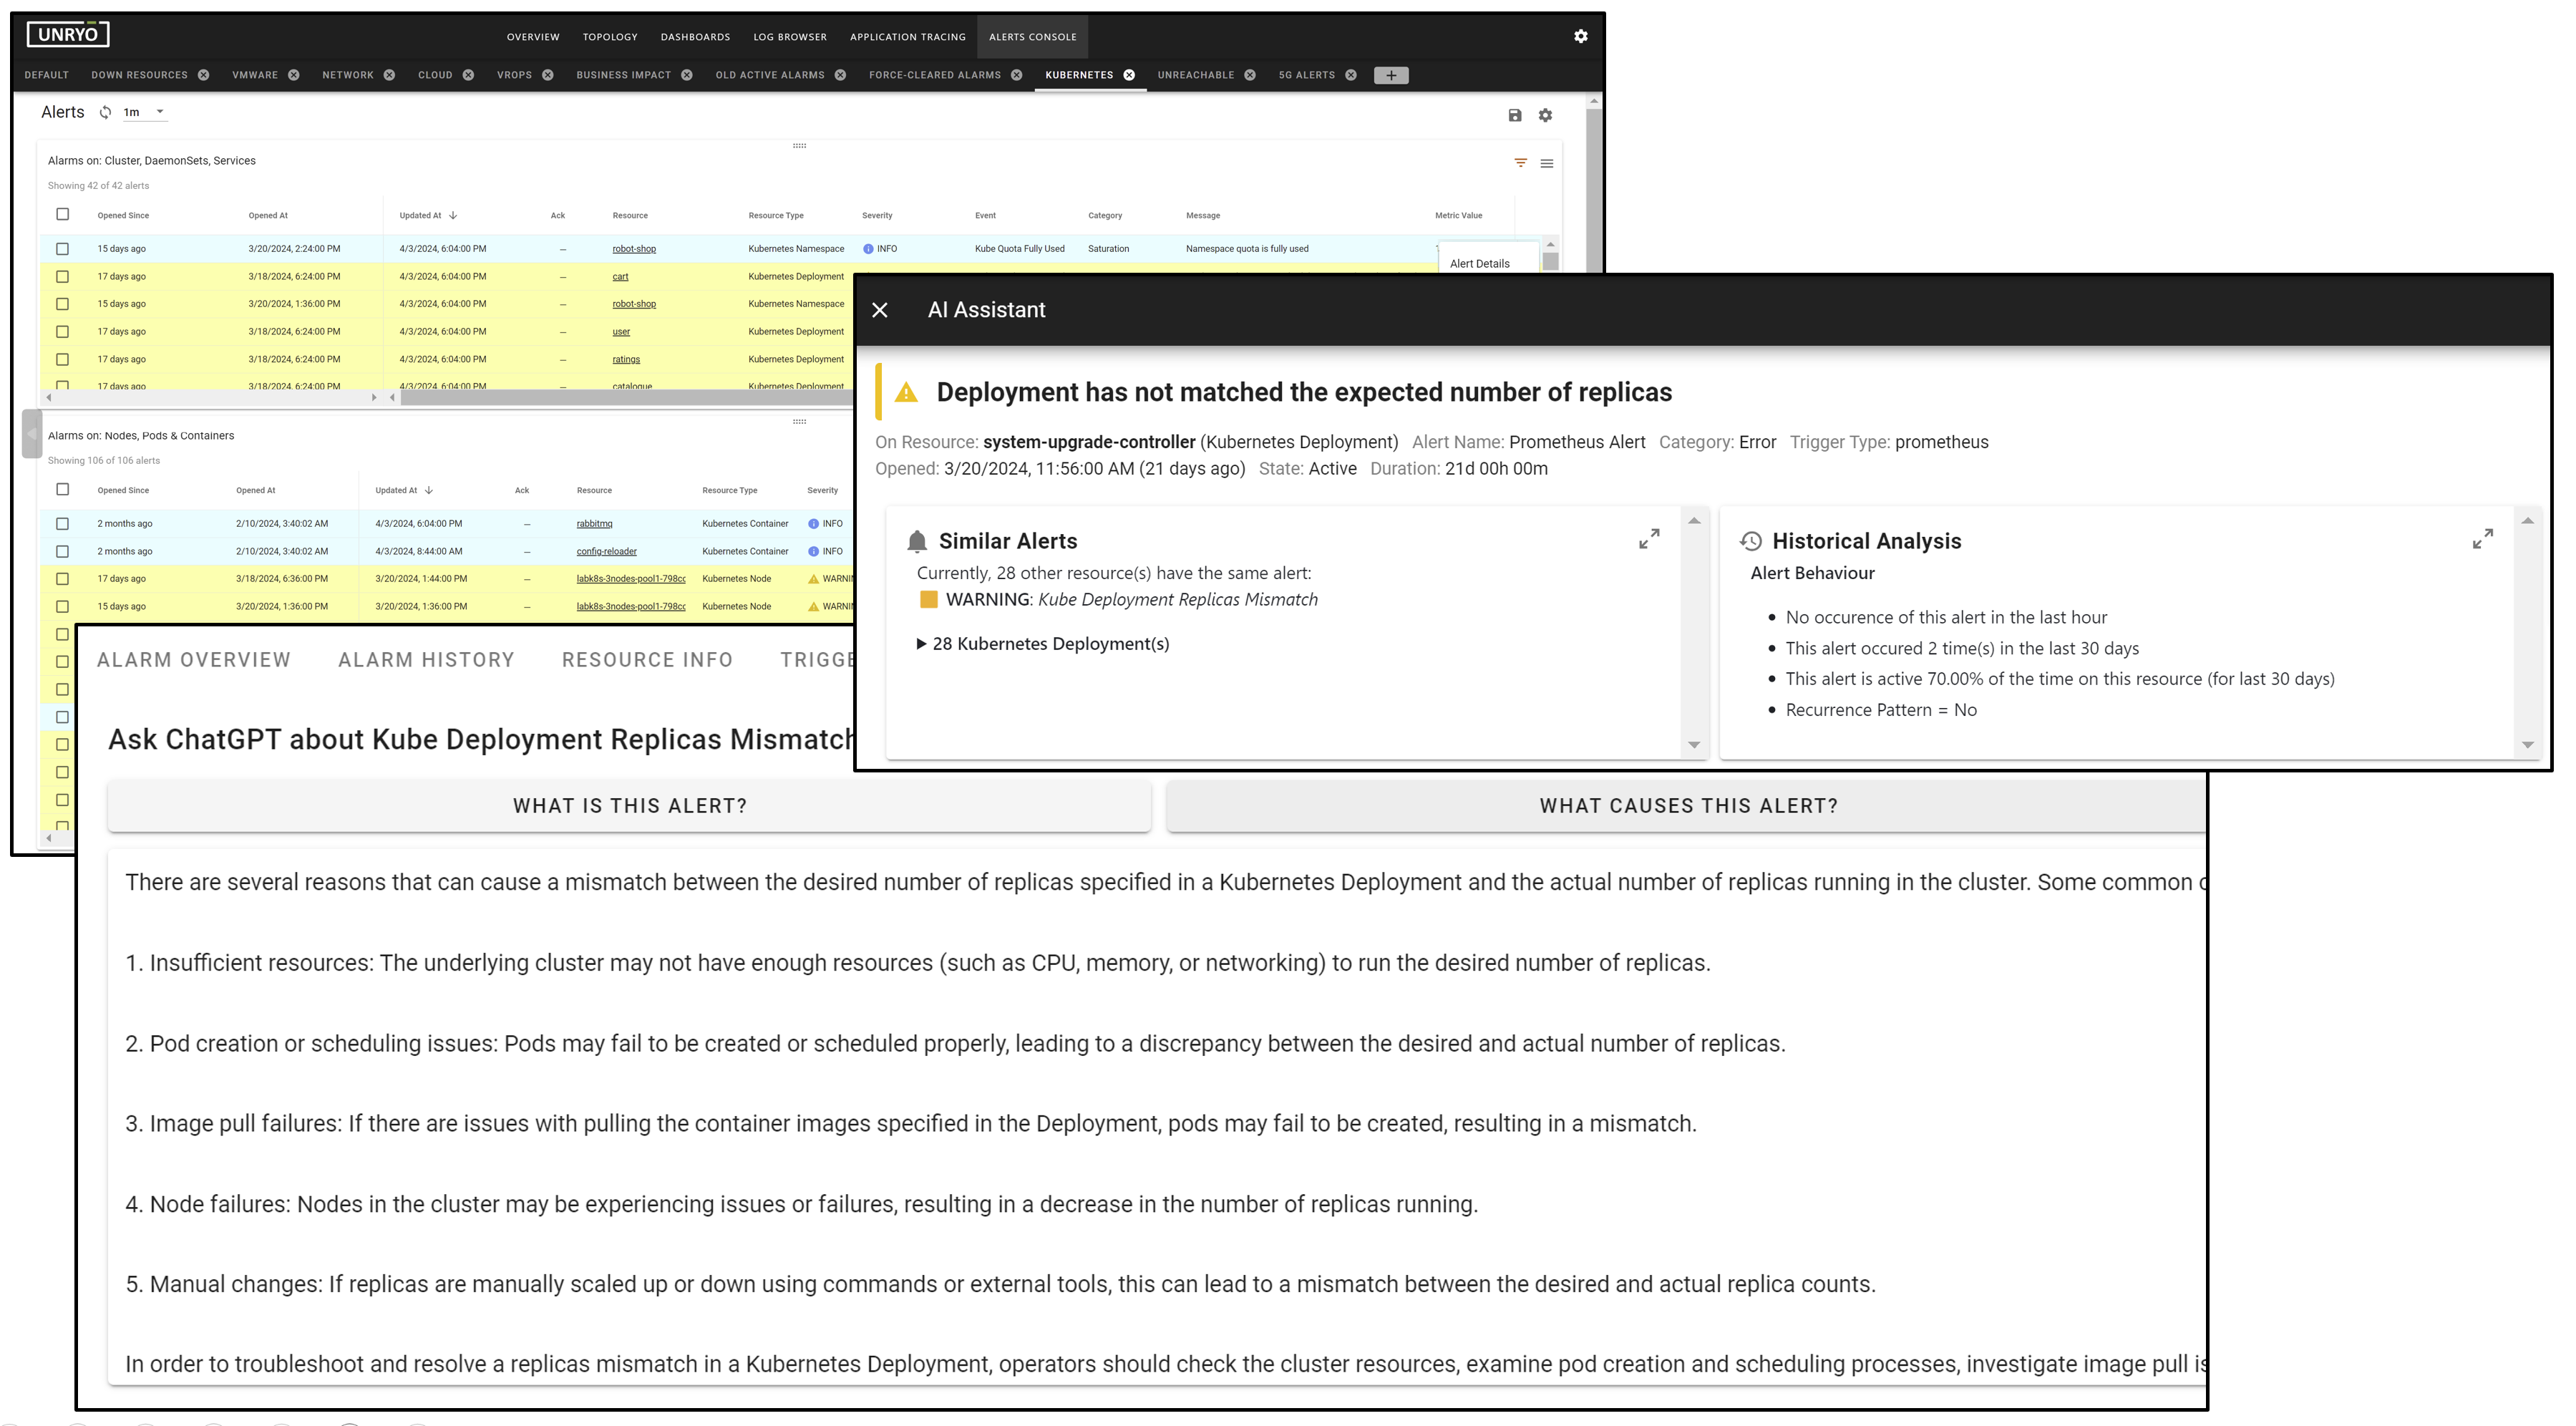
VM and Server Observability
AI-powered observability for servers and VMs—correlating metrics, logs, and processes across hybrid environments with dynamic maps, root cause analysis, and LLM-driven insights that reason like a real sysadmin.
Broad Support with Curated Analysis
-
Deep Platform Integration: Automatically monitor VMware vSphere, Proxmox, KVM, public cloud VMs (AWS, Azure, GCP), Linux and Windows with agentless or agent methods.
-
Metric Anomaly Detection covering system, disk, network, processes, HBA cards and service responsiveness.
-
Logs and Traces: Consolidate and analyze traces from servers (syslog, SNMP traps, ...) and your existing monitoring landscape tools.
Meet our AI agent
-
Designed to reason like a seasoned sysadmin, the AI agent synthesizes system states, telemetry, dependencies and logs to correlate issues.
-
Topology-based Root Cause: the AI agent analyzes dependencies such as Host-VMs to identifies which component(s) are driving resource pressure.
-
Users get clear insights and visualization: real-time, historical and projection dashboards, dynamic live topology maps, and contextual recommendations.
LLM Reasoning Pattern Examples
-
When CPU or memory usage spikes, the AI agent inspects active processes, correlates them, and flags misbehaving ones.
-
If an application is unresponsive, the AI agent scans system and application logs, connects error patterns to surfaces likely causes.
-
When cloud-based VMs degrade, the AI agent checks provider status, correlates latency from synthetic tests, and traces upstream service dependencies to pinpoint impact zones.