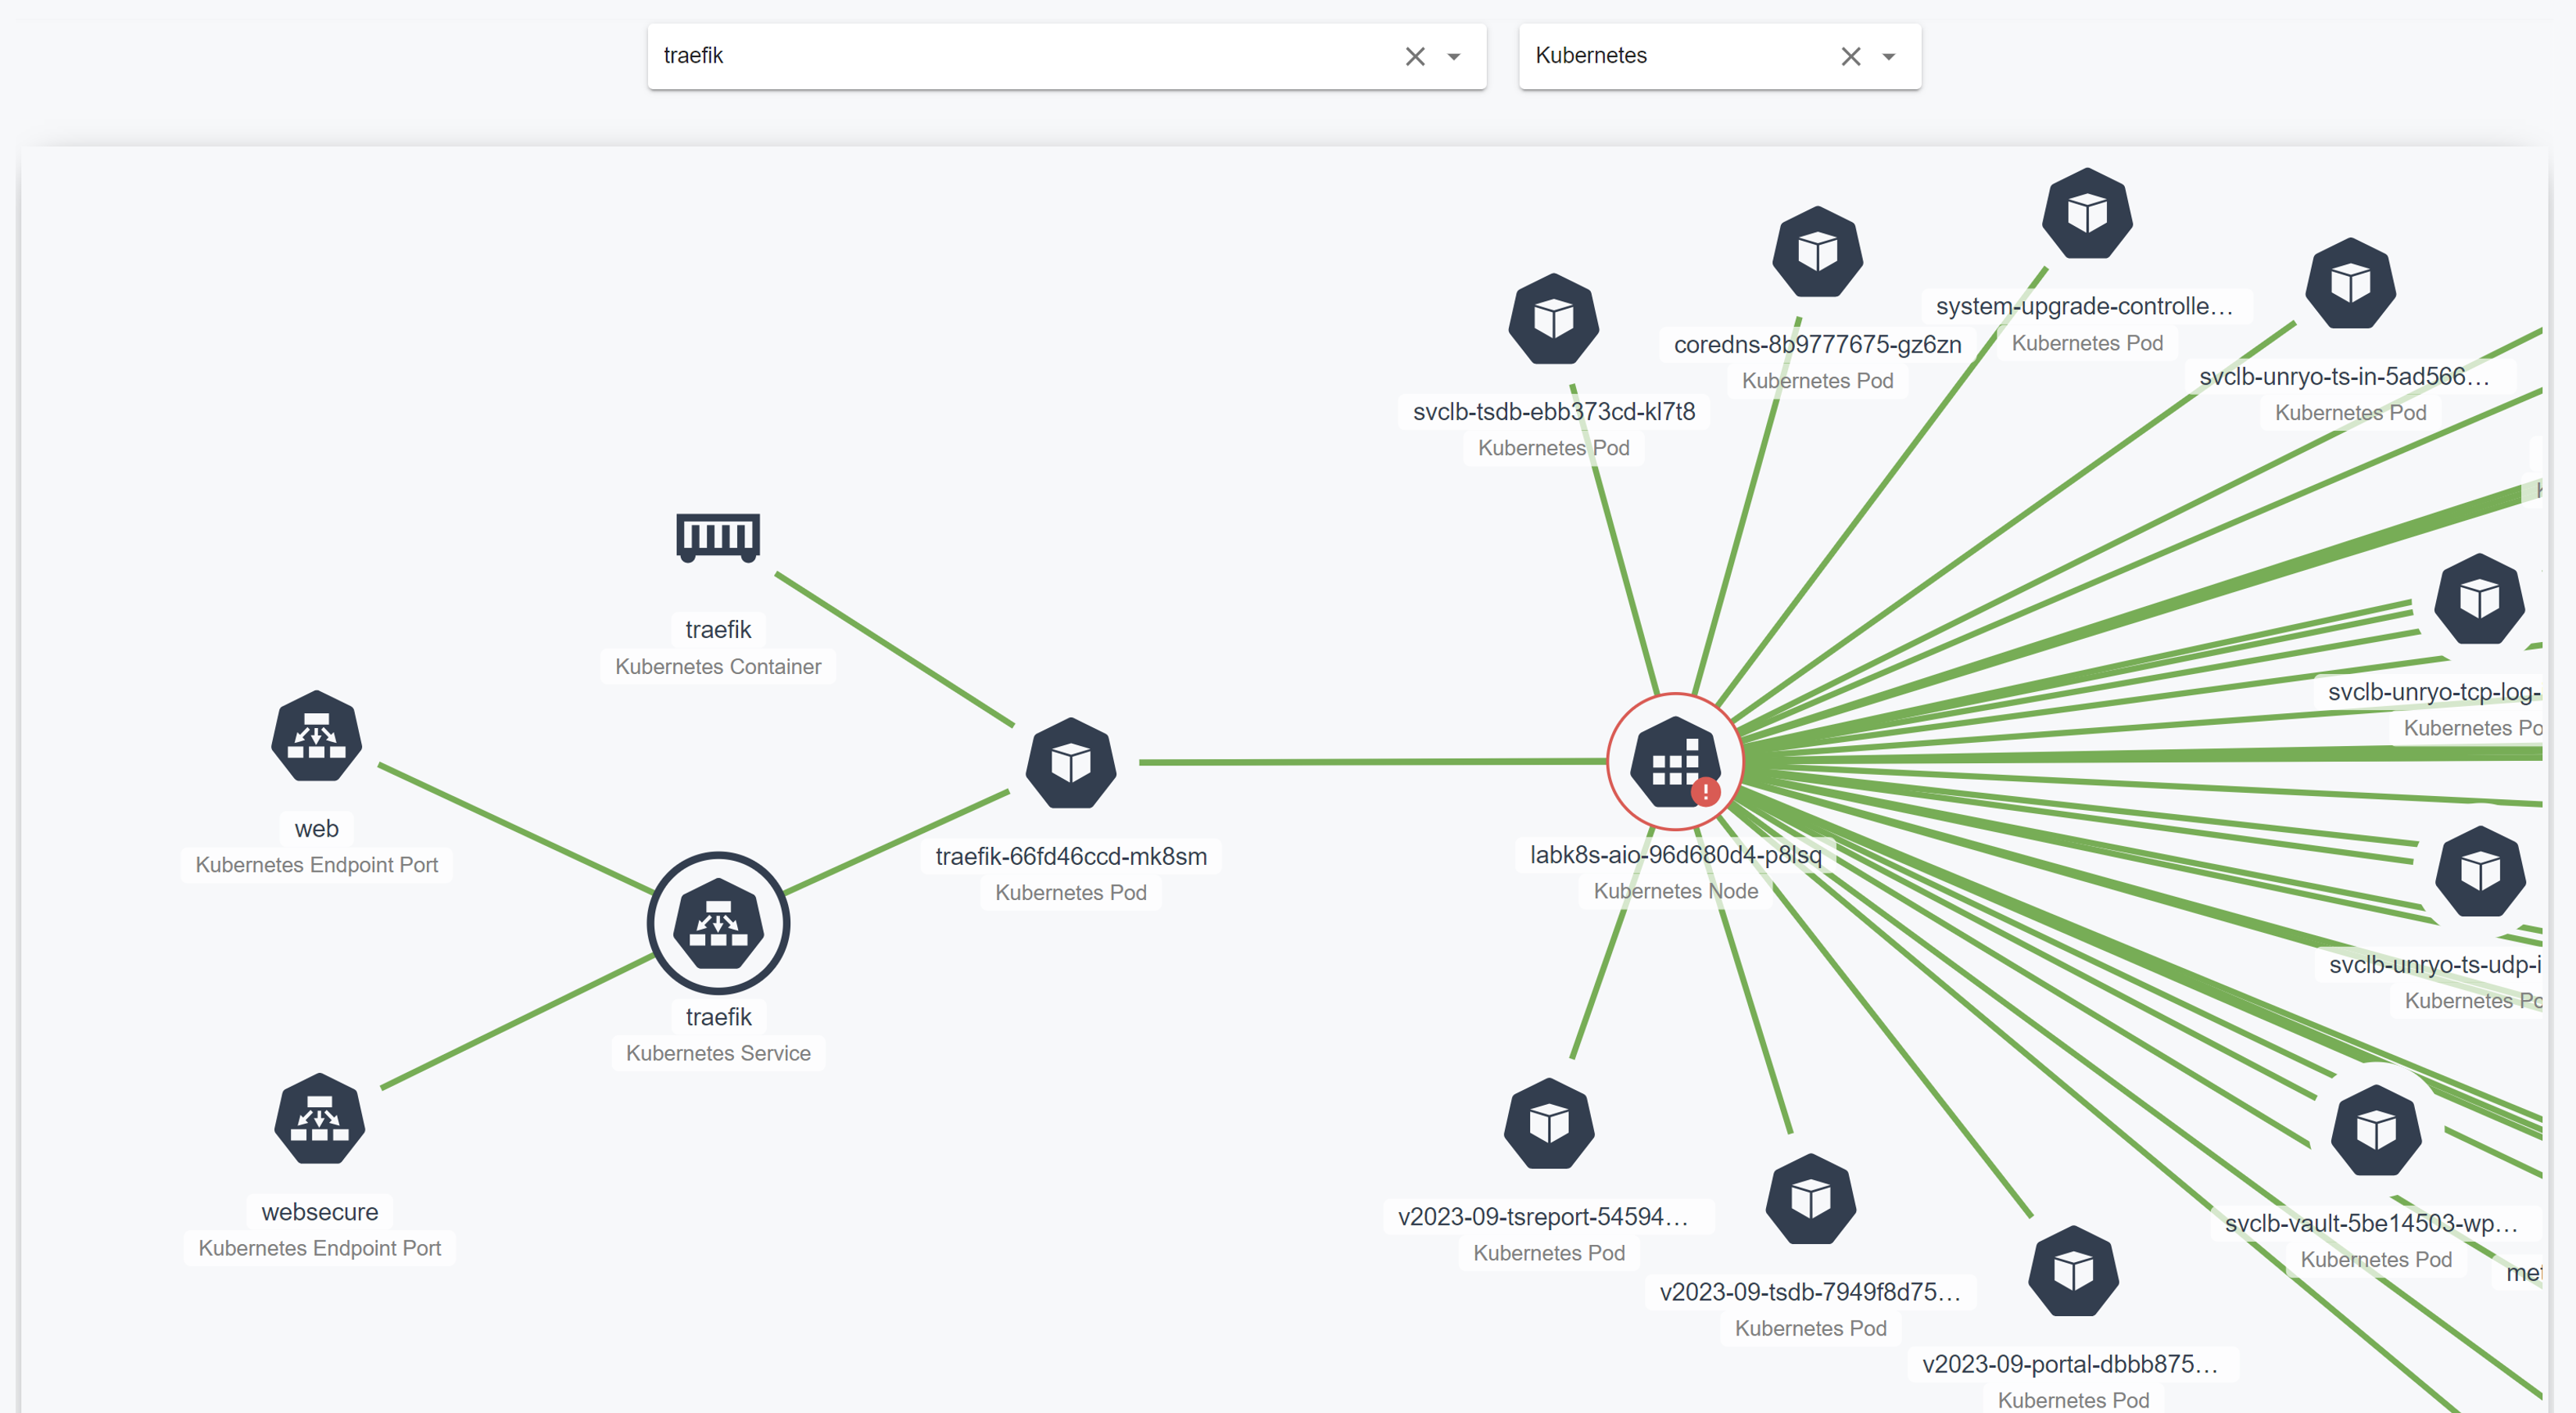
Dynamic Maps
Show dependencies between clusters, nodes, pods, deployments and services.
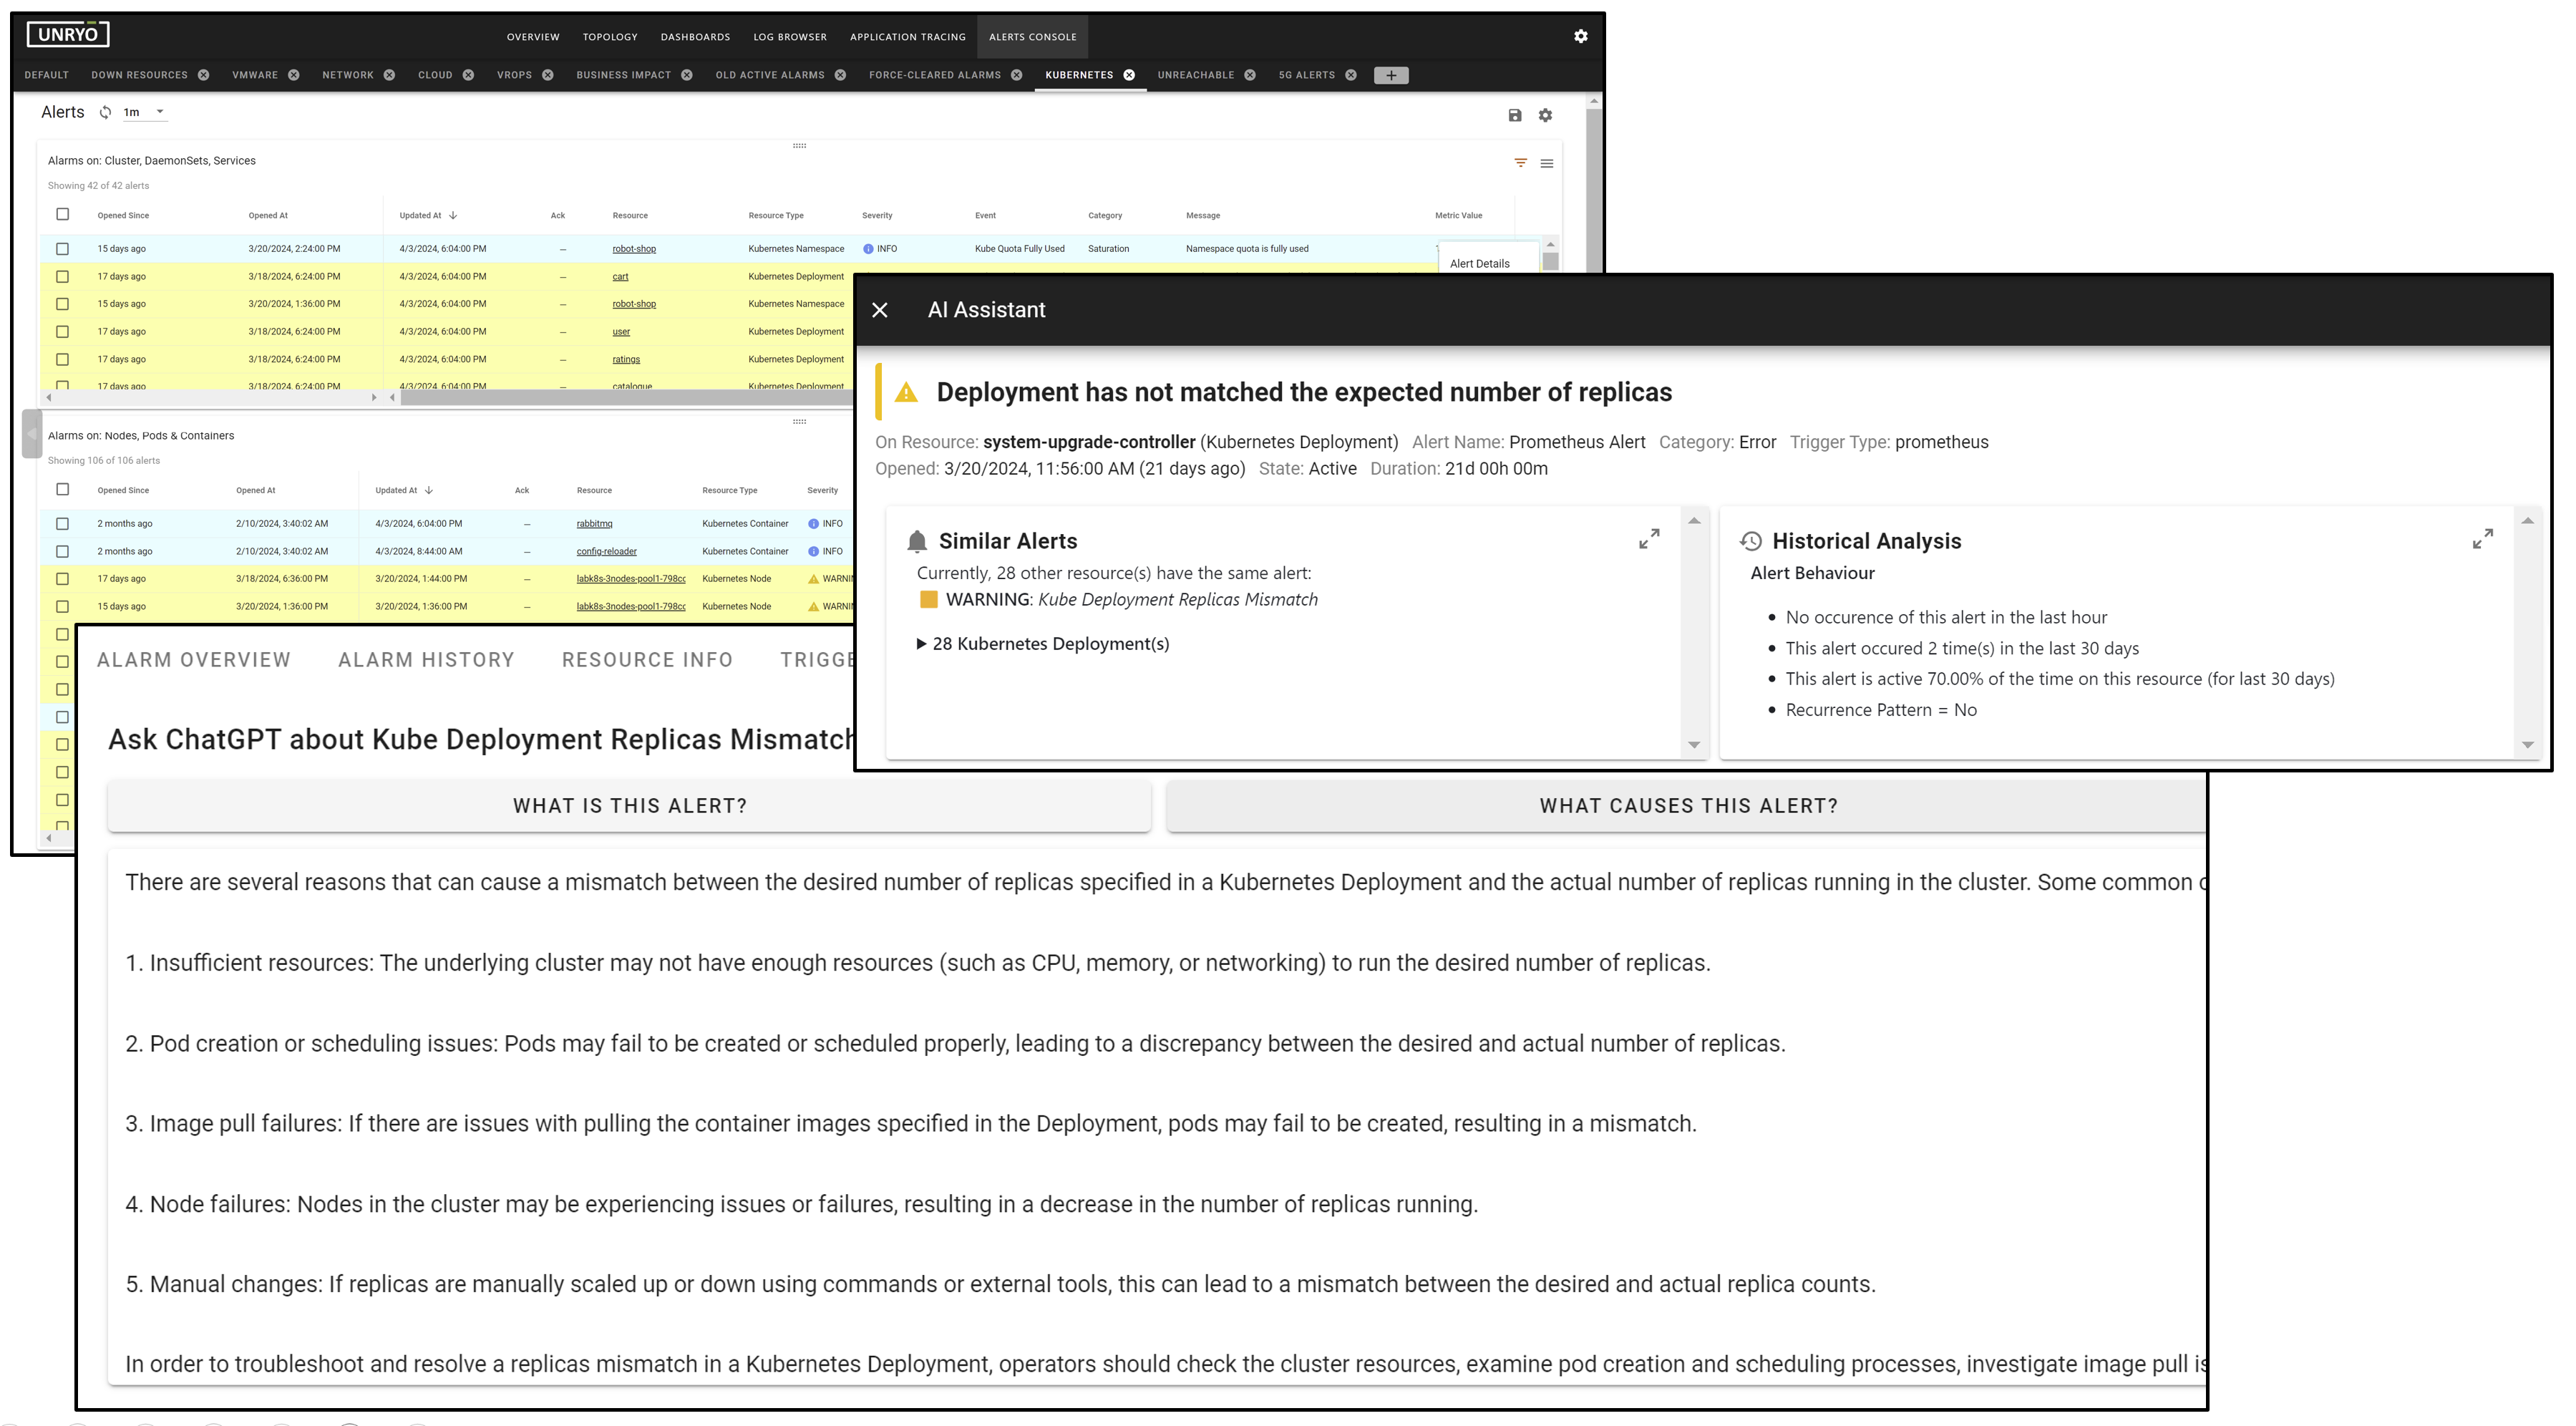
Automatic RCA and Impact
Spot issues quickly and get remediation guidance with an AI assistant.
Dynamic Dashboards
Visualize cluster performance and understand resource utilization.
Kubernetes Observability
Live visibility inside your Kubernetes clusters.
Unryo infers the Kubernetes topology and finds insights by querying your available data sources : Prometheus, Kubernetes API, Istio, VictoriaMetrics, Kepler (sustainability reports) and more.
Dependency Mapping with Topology-based Correlation
Holistic View of Kubernetes resources across all your clusters
As Unryo ingests data, it builds a dependency map by discovering all your cluster resources - nodes, pods, services - and the relationships between them. This topology knowledge is used by the correlation engine to understand in real-time the causal and impacts relations between nodes and across layers, between infrastructure components and business services.
Interactive dashboards
See metrics, logs and events from Kubernetes Nodes and Pods
Unryo provides interactive dashboards and reports at all levels, helping ITOps teams and diverse stakeholders getting clear visibility. Understand overall cluster resource utilization, identify nodes under pressures and workloads consuming the most resources.
AI Assistant
Reduce alert fatigue and get guided remediation
The AI assistant offloads your operation teams by automating the investigation work. It summarizes, in one view, the situation around the selected alert: all the necessary information, why the alert triggered, the context around it, the correlation results, and prepare troubleshooting steps for the user.