
Multi-Protocol Ingestion
Collect and normalize data from diverse IoT protocols including MQTT, OPC UA, Modbus, and more.
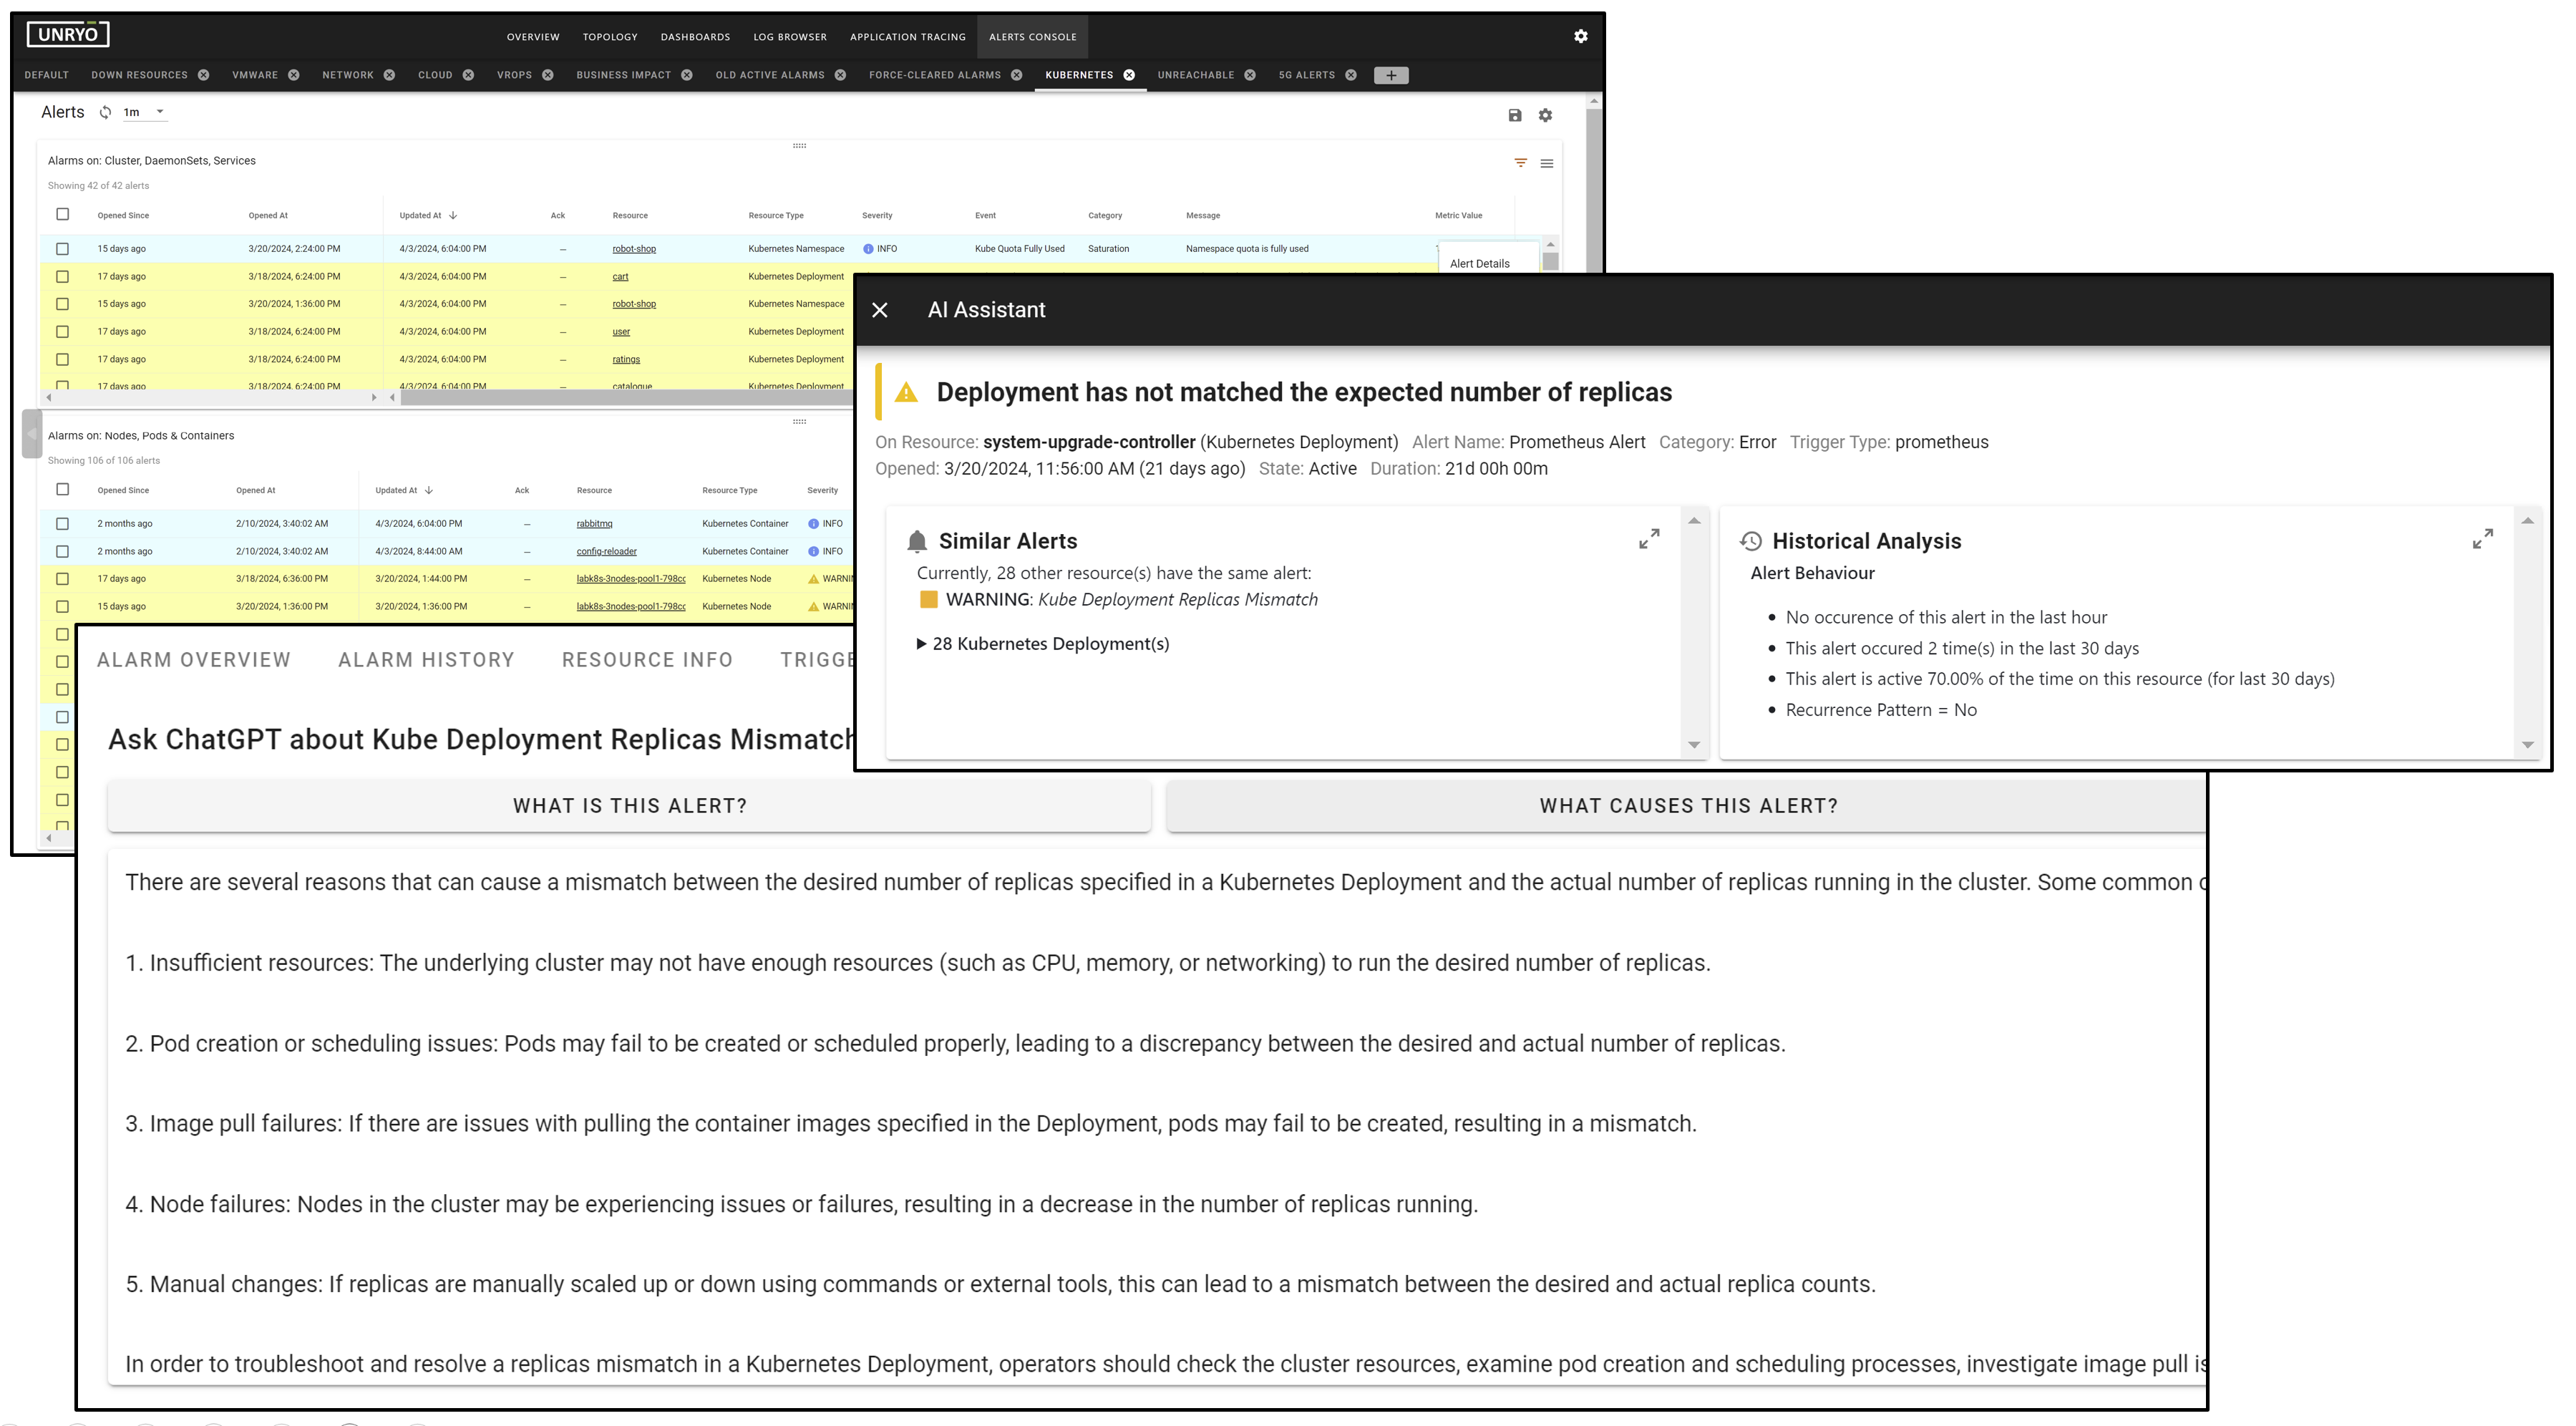
Live Monitoring and Analytics
Analyze and correlate IoT data from sensors and connected devices using agentic AI capabilities.
Industrial Insights
Get visibility into production efficiency, quality metrics, and supply chain performance through connected systems
IoT Observability
IoT monitoring is the process of detecting, tracking, and managing connected devices, analyzing their data in real time to deliver insights, alert on issues, and enable rapid, data-driven responses across your IoT infrastructure.
Advanced Data Acquisition
-
Multi-Protocol Support: Ingest data from devices using protocols like MQTT, CoAP, SNMP, HTTP, and Modbus for flexible integration.
-
Edge-to-Cloud Coverage: Collect telemetry from edge sensors, gateways, and cloud APIs for complete end-to-end visibility.
-
Lightweight collectors deployed at the edge: deploy easily collectors at the edge, near your devices, from the central configuration UI.
Analytics and AI-driven Correlation
-
Time-Series Anomaly Detection: Automatically baseline device behavior and detect outliers in metrics such as temperature, battery voltage, or signal strength.
-
Event Correlation: Group related alerts across device fleets and infrastructure to reduce noise and highlight root-impacting events.
-
AI-Based Root Cause Analysis: Use AI agents to identify root causes, correlate metrics (e.g., latency, packet loss), and assess service impact across IoT and backend systems.
Superior Data Visualizations
-
Topology Maps: Dynamically map device relationships, gateways, and data paths for quick fault isolation.
-
Fully Customizable dashboards: Drill-down from fleet-wide aggregated views to device-level granularity metrics.
-
Contextual Visualization: use tag- and metadata-based filtering (e.g., by location, device type, or firmware version) to refine visualizations and alerts.