
Kubernetes Metrics
Analyze metrics such as pod and node resource usage, cluster health, and map service and infrastructure dependencies.
Node Exporter and Windows Exporter
Analyze key system metrics such as CPU usage, memory utilization, disk I/O, network throughput, process statistics, and system uptime.
Custom Queries and Processing
Custom configurations let Unryo target your data structure for precise queries and relationship mapping
Prometheus Integration
Centralize the metrics and events from all of your Prometheus servers, with advanced visualization, anomaly detection and AI correlation.
Elevate your Prometheus Monitoring
Challenges
Prometheus excels at collecting and querying metrics but has limitations in scalability, long-term storage, and high-cardinality data. It offers basic visualization and lacks advanced analytics, AI capabilities.
Value Proposition
Unryo connects to your Prometheus server(s) by correlating them with other data sources. This powerful combination delivers AI-driven insights, improves troubleshooting capabilities while keeping your Prometheus investment intact.
Direct Prometheus Connector
-
Connects to one or multiple Prometheus servers, or any PromQL compliant server.
-
Secure Configuration Management: Connector settings, including credentials, are securely stored in an on-premise vault
-
Custom Polling Capabilities: Users can activate or deactivate built-in pollings, or define custom queries for tailored data collection.

Advanced Visualization and Topology Mapping
-
Dynamic Topology Discovery: Unryo analyzes metric metadata to uncover dependencies among Kubernetes resources and other components.
-
Predefined Configurations: Out-of-the-box support for Node Exporter, Windows Exporter, Kubernetes, Istio and more.
-
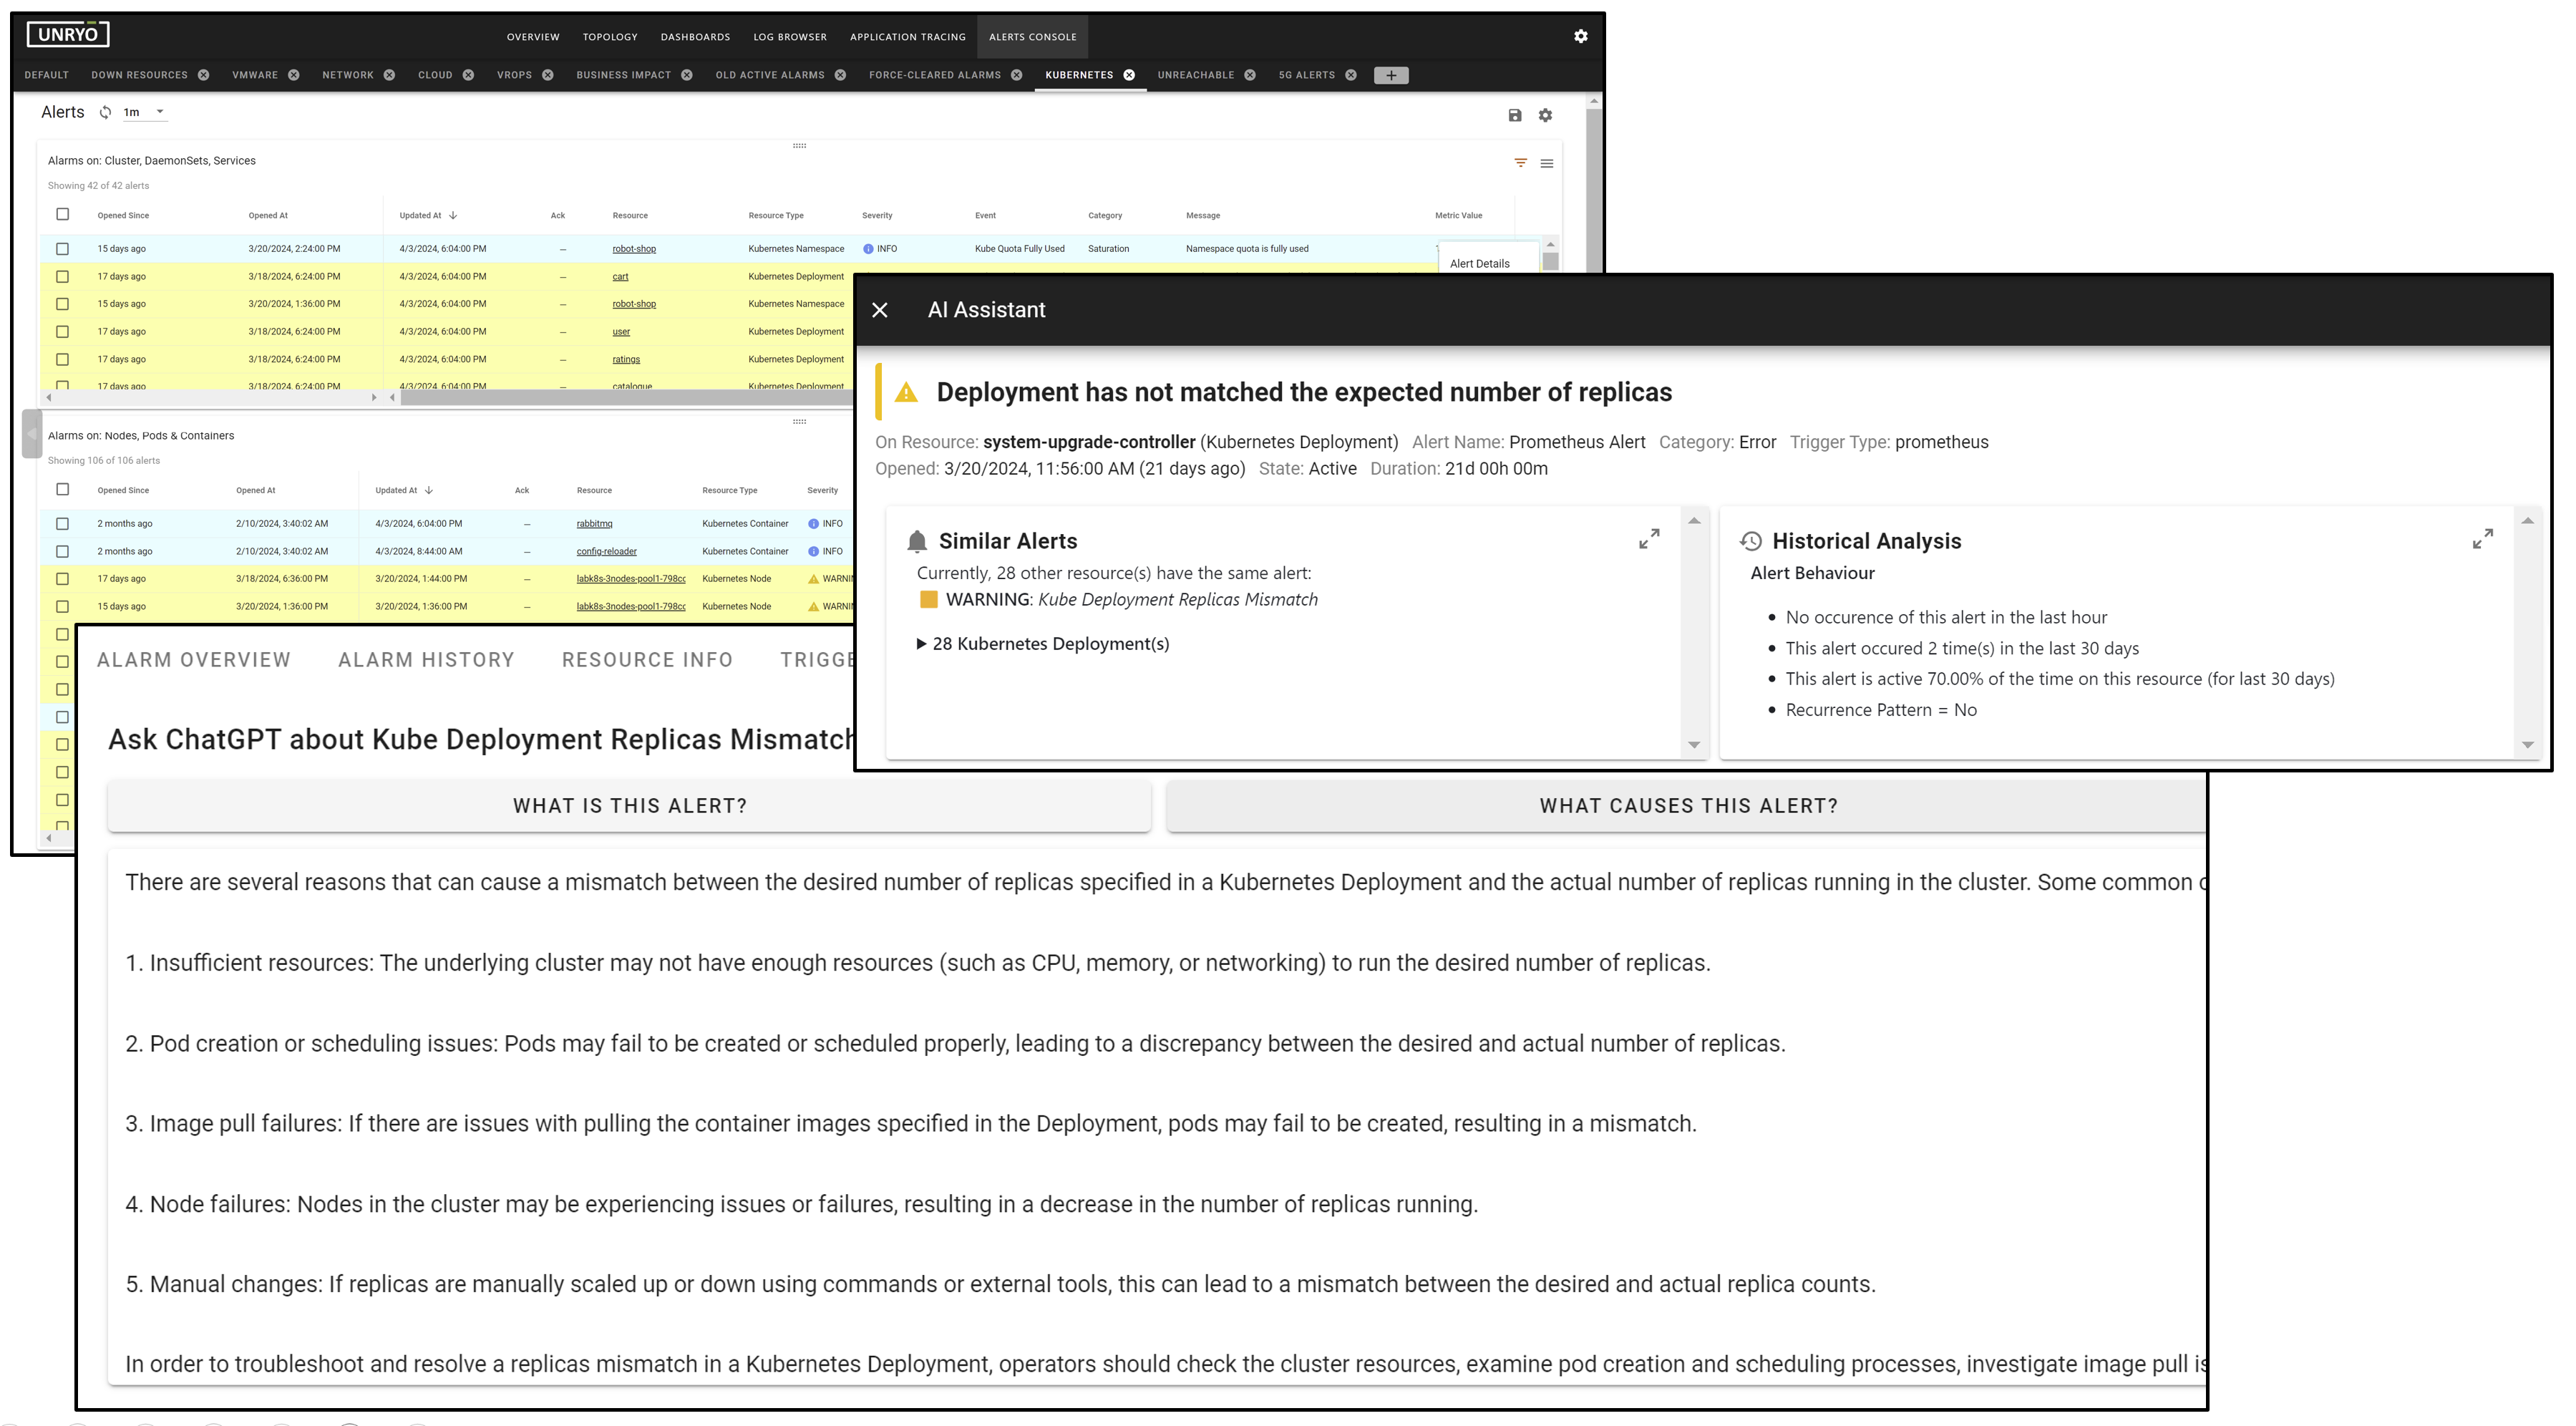
Centralized Alert Management: Events and anomalies detected through Prometheus are integrated into Unryo's unified alerting system
AI-Driven Correlation and Insights
-
Non-Intrusive Data Correlation: Unryo queries Prometheus data without duplicating it, acting as a correlation and consolidation layer atop existing monitoring stacks.
-
Anomaly Detection: By analyzing metric values, Unryo identifies anomalies, enabling proactive issue detection and resolution.
-
Root Cause Analysis: Leveraging its AI correlation engine, Unryo surfaces root causes of issues by understanding the interdependencies within the monitored environment.