Dell EMC PowerMax
Unryo monitors Dell EMC PowerMax by collecting key metrics, discovering storage components and connected hosts in real time, and using AI to detect root causes and forecast capacity issues.
Multi-Vendor Support
Instant storage analytics for Brocade, Cisco, Dell EMC, Hitachi, Huawei and beyond.
End-to-End Path Discovery
SAN connectivity and host-to-LUN relationships discovered automatically.
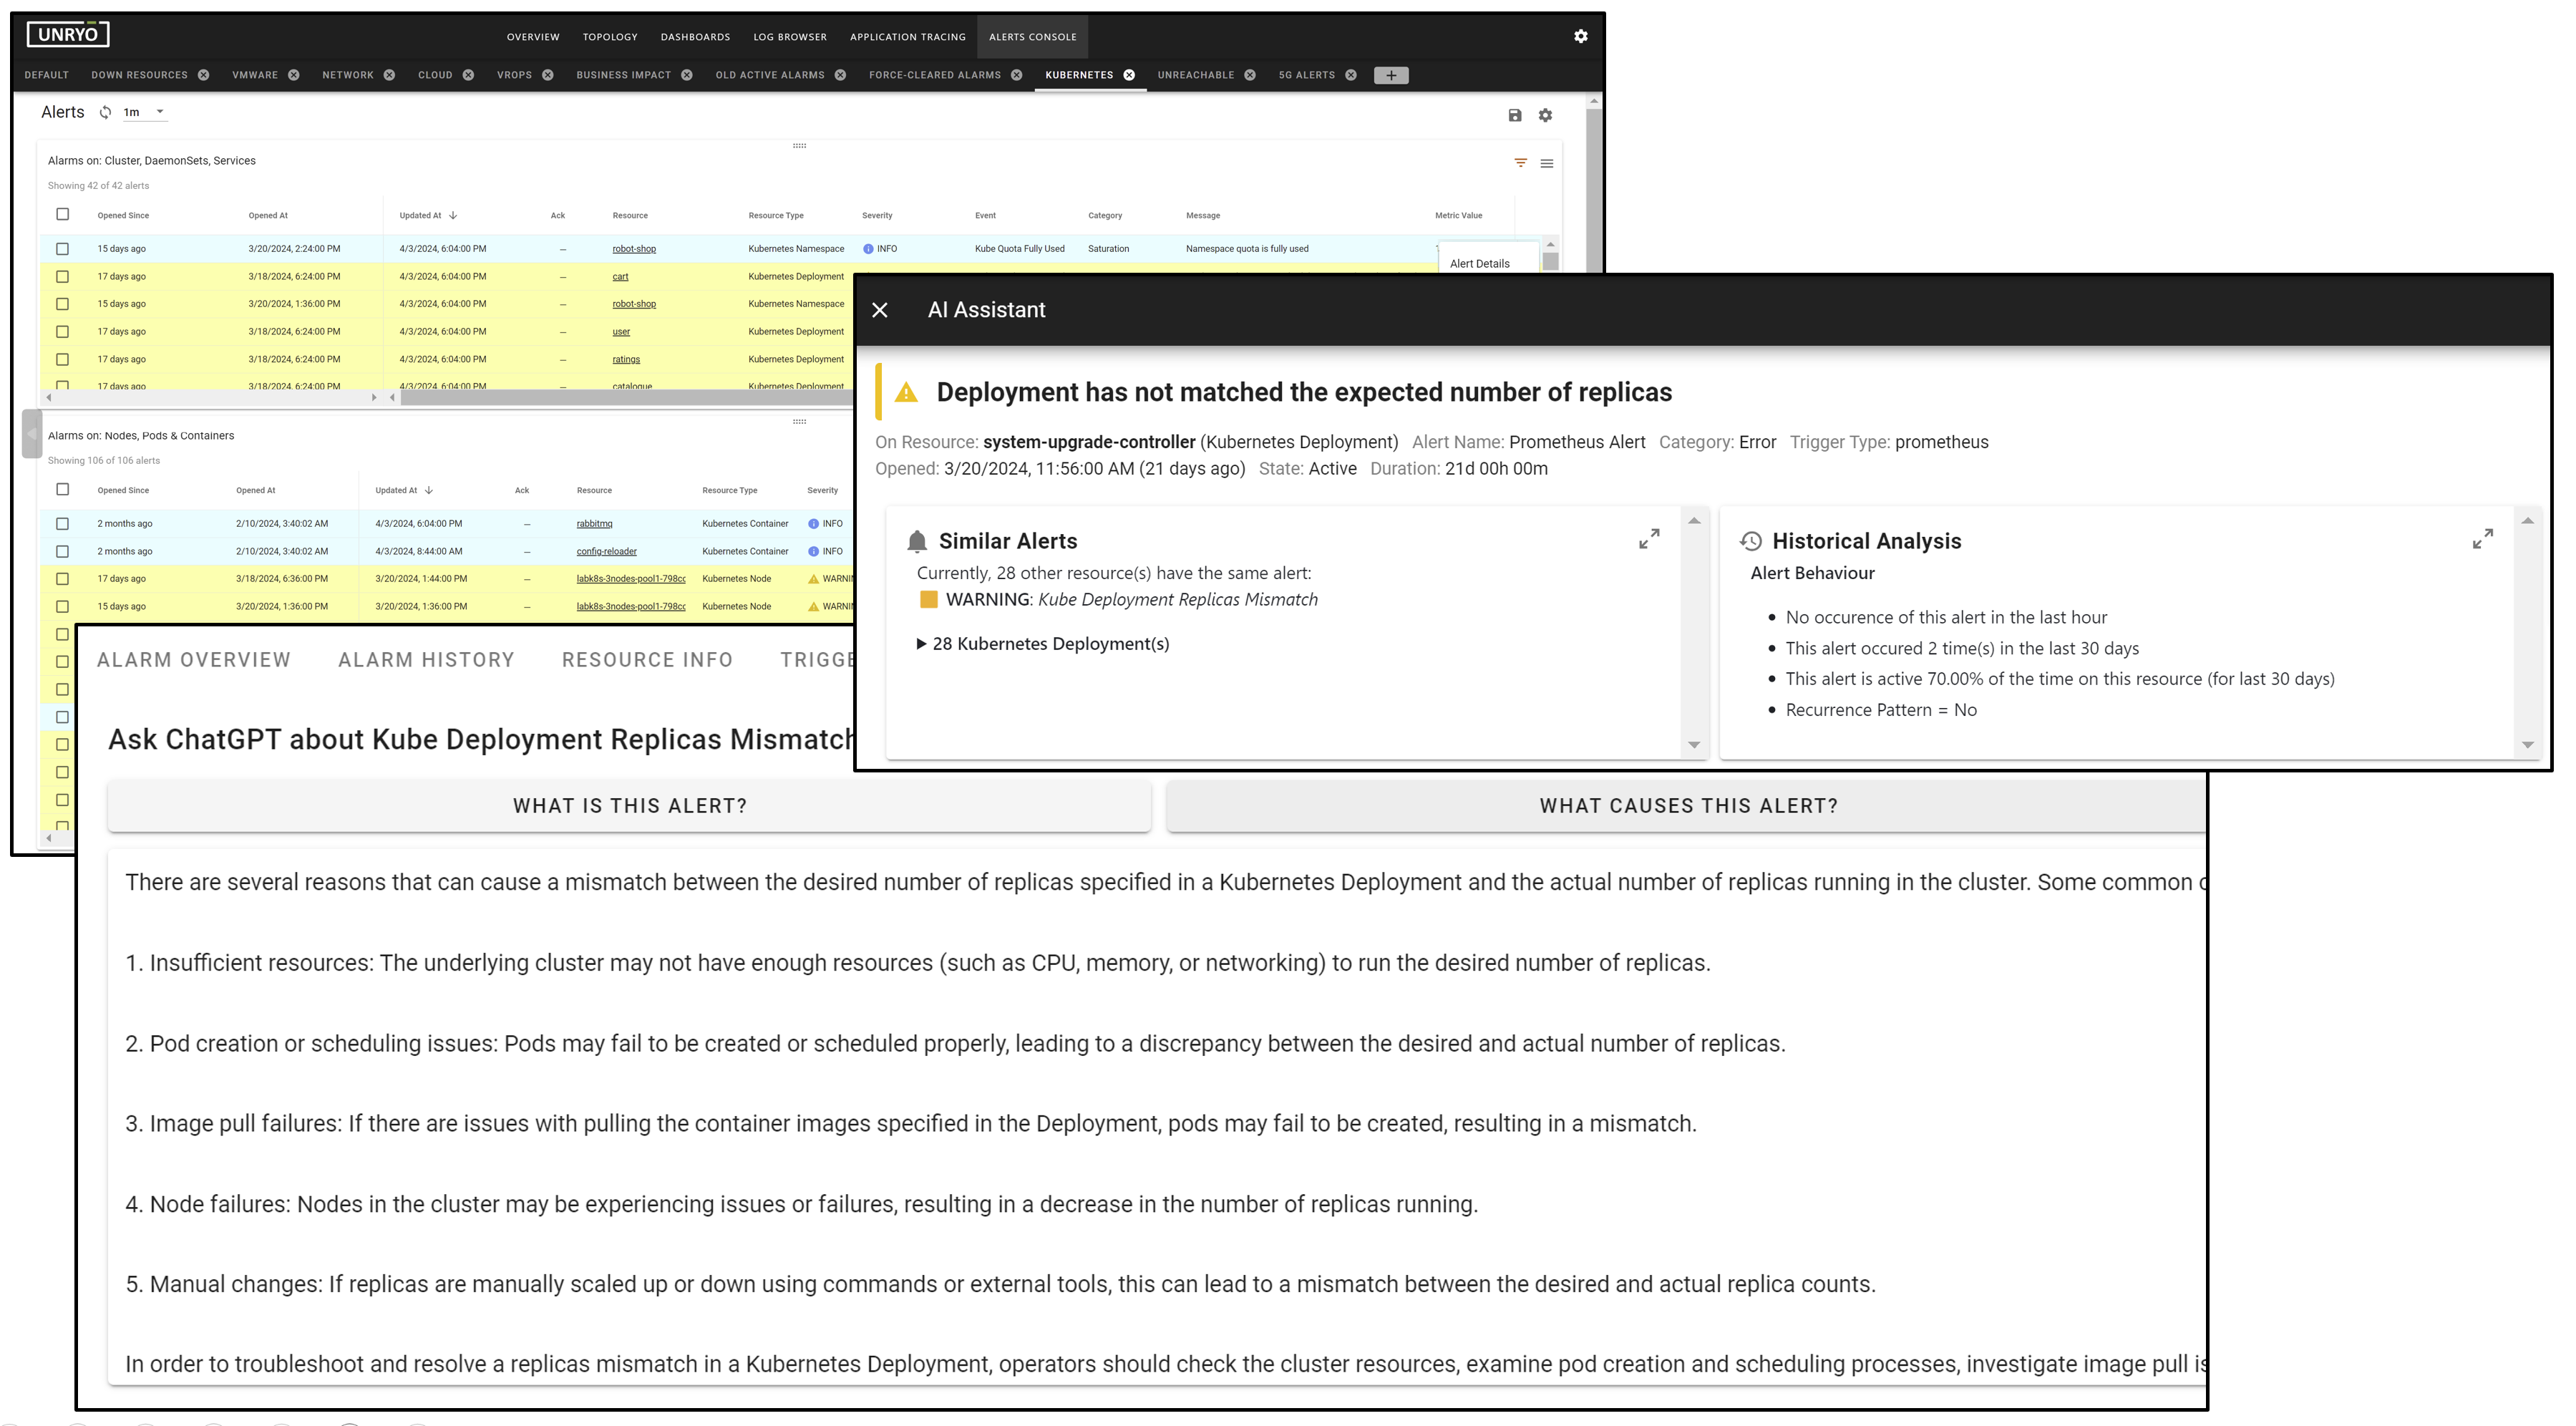
AI insights on storage issues
Predict capacity issues and detect anomalies for smarter storage management.

Efficient Data Collection via Unisphere
-
Uses Dell Unisphere REST API to collect PowerMax metrics securely and in real time.
-
Configurable Polling Templates: Control which metrics and components to poll—volumes, directors, ports—with customizable intervals.
-
Key Performance Metrics: Tracks curated KPIs like IOPS, latency, bandwidth, and capacity per array, storage group and connected device.

Dynamic Storage Topology & Dashboards
-
Live Dependency Mapping: Visualizes array components and their links to hosts and fiber switches.
-
Capacity and Performance Dashboards: Predefined views for performance, health, and trends—easily customizable.
-
Alerting & Alarm Console: Centralized interface for real-time alerts based on thresholds and anomalies.
AI-Powered Analytics & Insights
-
Root Cause Detection: Correlates issues from storage to impacted hosts or applications.
-
Capacity & Utilization Forecasting: Detects abnormal growth and predicts resource exhaustion.
-
Host Impact Analysis: Assesses how storage issues affect VMs or servers via I/O metrics and behavior.